Your school name
10th Class Mathematics Chapter 12 Test10th Class · Mathematics · Federal (FBISE)
Q1. Multiple choice questions (Attempt all · 10 × 1 = 10)
- CV is given by the formula:
- Which of the following divides the data into two equal parts?
- Probability of rolling a standard cubical dice for an even number in 2 attempts is —— than probability of rolling an odd number in 2 attempts.
- Which of the following divides the data into ten equal parts?
- Which of the following is not a measure of dispersion?
- Which of the following is used to compare the consistency of two data?
- Line of best fit is given by the equation:
- Which of the following divides the data into hundred equal parts?
- Probability of drawing a king in one draw is —— than probability of drawing 2 kings in 2 draws.
- Which of the following is measure of dispersion?
Q2. Short questions (Attempt any 6 of 8 · 6 × 2 = 12)
- Raabi and Jerry are hoping on their play circles of four sectors each painted in red, green, yellow and blue colours. Find the probability that they will jump on: (1) At the same colour (2) At the different colours.
- What is the probability that both coin A and coin B land heads up if both coins are flipped simultaneously?
- Affan played a game with two possible outcomes L and W such that P(W) = 0.4 (40%) and P(L) = 0.6 (60%). Find the probability of either winning or losing the game.
- Sundas draws 2 cards one after the other from a standard pack of playing cards, such that: First draw → Any card (52 possibilities) Second draw → Any card (51 possibilities, since one card has already been drawn) then find the probabilities of: (1) Both black cards (2) Both hearts (3) First spade then heart (4) First Queen of Spades then King of Hearts
- Mr. Bilal can make either a left turn (L) or a right turn (R) at an intersection on his journey to Tiri Mengal. The probalitites of making a left turn and a right turn are: P(L) = 0.3 (30%) & P(R) = 0.7 (70%). Find the probability of making either a left or a right turn.
- The scores on a test were compiled into a dataset with the following quartiles: Q1 = 40 , Q2 or median = 70 , Q3 = 90
- Uzair scored in the 75th percentile on a test. Find how much percentage of the students scored below him and how much percentage of students scored above him.
- Sunayna tossed a fair coin with two outcomes: Heads (H) and Tails (T). The probabilities are: P(H) = 0.5 (50% chance of getting Heads) and P(T) = 0.5 (50% chance of getting Tails) find the probability of getting either Head or Tail.
Q3. Long questions (Attempt any 2 of 3 · 2 × 4 = 8)
- Data shows scores of Huffaz in a Hifz Quran test: Find standard deviation of the data.
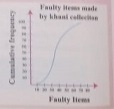
- The adjoining cumulative frequency curve shows the number of faulty items in a shipment of 100 items produced by Khani’s Collection. Estimate i) The median ii) Lower quartile iii) Upper quartile iv) IQR v) 7th decile vi) 30th percentile
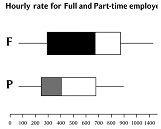
- Adjoining box & whisker plot shows wages for part time and full-time employees: (a) What is the amount of median wages paid to full time employees? (b) What are minimum and maximum wages paid to part time employees? (c) What is IQR for the dataset of fulltime employees? (d) What is IQR for the dataset of part time employees? (e) What type of correlation is observed in both datasets?