Your school name
10th Class Mathematics Chapter 11 Test10th Class · Mathematics · Punjab (PTB)
Q1. Multiple choice questions (Attempt all · 10 × 1 = 10)
The range is the ...... of min. value of a data set:
Second quartile represents:
The box in Box-and-Whisker plot represents:


IQR
Range of first 20 natural numbers is:
...... is measure of dispersion:
The quartile named as lower quartile is:
Z1
Positve square root of variance is called:
If one variable increases as the other decreases, then is is:
A line within the box represents:
Median
IQR
A table comulative frequencies also know as:
Q2. Short questions (Attempt any 6 of 8 · 6 × 2 = 12)
The sum of 5 numbers is 45 and the sum of their squares is 421. Find the mean and standard deviation of the data.
Find the range of the following data set: 63,89,98,125,79,108,117,60
A company forecasts monthly sales (rupees in millions): 15,18,14,20,13. Find the variability in sales predictions.
Find
 median, minimum and maximum values for the following box-and-whisker plot.

If the range and the lowest value of a set of data are 46.7 and 13.4 respectively, then find the highest value.
Find the range of the given date: 25,30,35,40,50,60,65,75.
Kiran recorded the numer of days it rained or snowed each month during the last year. The following box.and-whisker plot displays her data (image). (i) What do the extremes tells about the number of days ot rained or snowed? (ii) What is the median number of days it rained or snowed? (iii) What are the upper and lower quartiles for the data? (iv) Where the most data is clustered?
Find the range of the following data set: 43.5,13.6,18.9,38.4,61.4,29.4
Q3. Long questions (Attempt any 2 of 3 · 2 × 4 = 8)
Draw the cumulative frequency polygon for the following frequency distribution of the weekly wages (rupees in thousands) of number of workers by more than method. Also locate
 on it.
Weekly wages (rupees in thousands) 0-20 20-40 40-60 60-80 80-100 No. of workers 30 48 61 40 21 A group of workers reported the number of items they assembled in a day as: 52,55,50,53,54,56,52 Find the standard deviation and variance of the items assembled.
The following result for the long jump were recorded:
Distance (in cm) 170-180 180-190 190-200 200-210 210-220 220-230 f 2 6 9 12 8 3 Construct the cumulative frequency polygon and locate median,
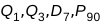 and interquartile range on it.